Analyze: Step 3 in the DMADV Process to Improve Your Supply Chain
Jose Bejarano | 30 June 2014
In previous editions of this article series the Define and Measure stages of a Five Step Decision Making Process (DMADV) to drive supply chain improvements were discussed. During these first two stages the parameters, variables and constraints of the system in question are defined and quantitative and qualitative information is gathered, thus preparing the field for the third stage of this approach.
The Analyze step, as the reader’s intuition may indicate, relates to the analysis of the quantitative and qualitative data collected during the Measuring stage. First, the overall performance of the system is evaluated using statistical models to analyze transactional and inventory data. The results of this preliminary analysis help determine patterns and trends in the data as well as validate the accuracy of the collected data. Additionally, the initial analysis provides insight on the aspects of the system which require further examination.
The supplementary analysis that follows may vary depending on the problem statement, objectives and the particular system in question. However, a supplementary analysis includes a SKU profile, order profile, picking technology selection and sizing, among others.
SKU Profile
Also known as an ABC Analysis the SKU Profile is one of the basic studies performed in the warehousing and distribution industry. During this analysis the whole population of SKUs or stock keeping units is analyzed based on its movement in terms of units shipped, the number of times it is picked, and the number of orders it was picked for.
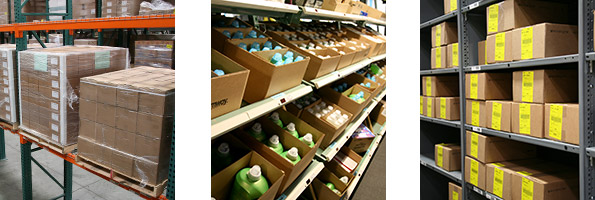
The results of the study provide a clear understanding on what are the fast moving SKUS (A items), the medium moving SKUs (B items) and slow moving SKUs (C items) which in turn give insight on what type of picking environment(s) should be considered for each SKU based on its velocity. Additionally, the SKUs can be analyzed in terms of their physical attributes to determine which SKUs need to be held in a particular storage environment or have special considerations during the picking or packing operations.

Order Profile
When conducting an order profile, it is important to keep in mind the different types of orders the system in question may handle as their properties may vary depending on the order type. For example, a given distribution center might handle e-commerce orders and retail orders where the e-commerce orders are delivered directly to the end customer and are composed of a small number of order lines and small product quantities. On the other hand, the retail orders may be shipped to stores and be composed of a large number of order lines and large quantity of items.
Once the order types have been identified each of them is analyzed to determine the typical order composition. Ultimately, the analysis will yield statistical distributions that describe the number of order lines per order, the quantity picked for each line, total items per order and even the type of items an order is composed of. Additionally, the different order types can be correlated to assess the possibility of picking orders that meet a certain set of criteria with the same process.
Picking Technologies Selection and Sizing
Selecting the adequate picking technology is no trivial task as the picking process can have a significant impact on the system’s operations and financials. Thus, supporting the selection process on data-driven insights provide the user with a competitive advantage.
As previously mentioned, the results of the SKU profile are used to determine what portion of the SKUs are A, B and C items. After matching the subsets of the SKU population to the corresponding picking velocities, a more detailed analysis is conducted on each subset to examine how the picking of the SKU subset varies due to seasonality, day of the week, time of the day or even a combination of factors. As a result a statistical distribution that describes the picking process throughput and accounts for the stochastic nature of the picking is produced, which would provide decision makers with how fast the picking technology needs to be.
It is also worth noting that the replenishment of inventory needs to be at least as fast as the picking rate in order to ensure the picking technology is stocked with the necessary inventory to fill orders. The second portion of the process is determining how big the picking medium needs to be, which is determined by cross analyzing the inventory data, SKU dimensions and the corresponding picking data. The results of the analysis provide insights on the amount of inventory needed for each particular item, the number of storage locations needed and the size of the locations.
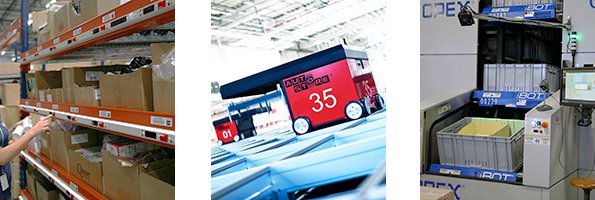
Once the replenishment rate, the picking rates and the storage volume requirements have been determined potential picking technologies can be evaluated. Often times the technology selection process will be affected by business strategy and operational preferences, but supporting the decision making process with accurate data-driven insights, provides a significant advantage and helps mitigate risk.

Given the results of the analysis step in the DMADV process, one can confidently proceed to the design stage knowing that an information driven design will yield a competitive solution to meet the system's performance requirements.
Read next: Design: Step 4 in the DMADV Process for Supply Chain Improvement
As Manager of International Sales, Jose works with Bastian international offices in Canada, Mexico, Brazil and India. Previously, in consulting, he worked with clients to evaluate their needs and operations in order to recommend solutions that help them increasing throughputs, productivity, and capacity. Jose leverages his extensive data analysis and modeling skills to glean insights from customer data to help drive fact-based concepts and designs. He has participated in projects across industries including medical devices, pharmaceuticals, apparel, and consumer goods. His projects include large green field DC designs, existing site retrofits, process improving and distribution network design and optimization.
Comments
No comments have been posted to this Blog Post
Leave a Reply
Your email address will not be published.
Comment
Thank you for your comment.